
Quantized endpoints charge less per token but more per answer
A pre-registered audit of PTQ vs QAT endpoints


Our previous analysis found that “black box” inference providers could be selling “lemons” to buyers: qualities of the endpoint not known to the buyers, and therefore not included in the pricing.
While conducting other tests, we found preliminary evidence that FP4 endpoints serving GLM 5.2 were prone to occasional runaway generations: the same question that finished normally on the FP8 endpoint would sometimes blow past 2× the token count, in one case hitting our 65k-token ceiling without producing an answer. We set out to investigate the depth of this discrepancy and what it does to the effective price of these endpoints. Are the savings of quantizations being kept by providers while silently pushing costs onto the consumer?
tldr; We found that on GLM 5.2, both FP4 endpoints cost more per solved problem than the un-quantized endpoint they undercut on paper: a listed 32% discount was actually an 11% premium, and a listed price parity became a 40% premium. Further investigation revealed 6% more tokens per problem, total-loss runaways billed at the token ceiling, and statistically distinguishable output distributions. For DeepSeek V4 Flash, a QAT (quantization-aware trained) model served by some of the same providers, evidence points to much more consistent performance.
Method
We examined two different models: GLM 5.2, released in FP8 and quantized to FP4 by third parties after training (post-training quantization, PTQ), and DeepSeek V4 Flash, which was trained for FP4 (MXFP4 QAT).
For each model, we choose 3 provider-pinned endpoints on OpenRouter — one from the model creator plus two quantized third-party endpoints. For GLM 5.2 we used Z.AI at FP8, DeepInfra at FP4, and Parasail at FP4. For V4 Flash we used DeepSeek at FP8, DeepInfra at FP4, and AtlasCloud at FP4. If FP4 PTQ degrades serving, both GLM FP4 arms should drift from the reference in the same direction while the V4 arms don’t.
Our pilot also showed that easier problems concealed the effect, so we chose 30 items drawn from MATH-500 level 5 and AIME 2024 / 2025, pre-screened so the non-quantized endpoints had successfully solved them in a single attempt. Because serving and the associated failures are nondeterministic, even at temperature 0, each arm ran all 30 items 3 times.
Two definitions, both fixed before we collected data. A problem is solved when the extracted answer exactly matches the dataset answer. A runaway is a completion that hits the 65,536-token ceiling without producing an extractable answer.
A hidden per-task premium
What the end consumer cares about is how much they spend per task completed, not per token. We summed OpenRouter’s reported spend per endpoint and divided by the number of problems solved.
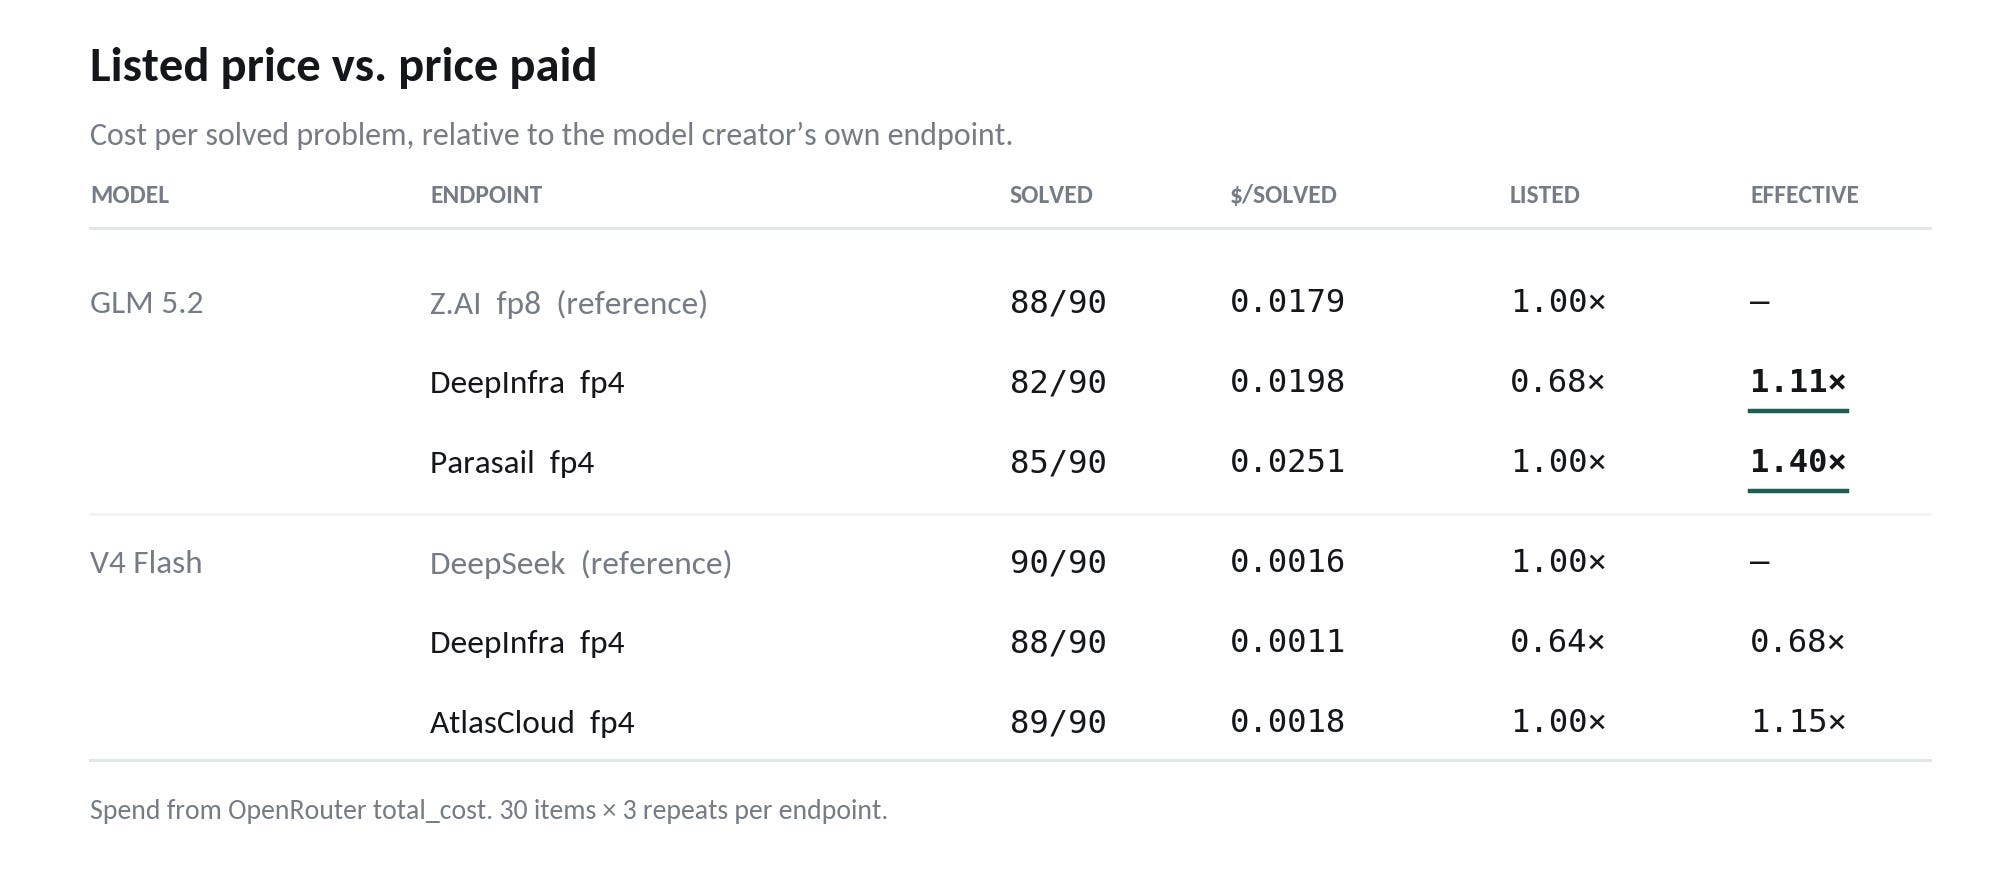
For GLM 5.2, DeepInfra lists output tokens at a 32% discount to Z.AI and delivered an 11% premium; a 43 point swing between advertised price and paid for the same tasks using the “same” model. Parasail lists at parity and delivered a 40% premium. Both endpoints inflated token counts and returned fewer answers: 82 and 85 problems solved out of 90, against 88 on the reference.
For V4 (QAT), DeepInfra lists at 36% off and delivers 33% off. AtlasCloud, on the other hand, comes in at 15% above listed parity.
At closer inspection, 95% of the premium from Parasail was a result of runaway billing. 2 cells billed our preset token ceiling, which resulted in 27% of that arm’s entire spend. Without the runaways, Parasail’s average costs per request becomes 1.01x the reference. Similarly, AtlasCloud’s effective up-charge was a result of a single runway cell.
While this isn’t enough to conclude that QAT fully protects users and offers them an equal effective and listing price, it does point to a possible reduction.
More concerning, none of this is visible in the places a buyer would look. NVIDIA's own model card for FP4 GLM-5.2 reports accuracy, the largest benchmark drop is 0.81 points, and three of five benchmarks score higher under FP4. Artificial Analysis does compute cost per task from tokens actually consumed, and notes that a model generating more reasoning tokens costs more per task at the same per-token price. But it reports a figure per model, taken from the first-party API or a median across providers, not a figure per endpoint. The divergence we are describing is between endpoints serving the same model, which is precisely what a per-model number averages away. Those counts also come from the providers themselves, and as we show below, third-party endpoints do not always report them accurately.
The academic work that has measured this most carefully ran locally rather than on billed endpoints, so it reports the phenomenon without pricing discrepancies. One recent study finds PTQ inflation from +3.7% to +43% at INT4 with accuracy largely preserved, and shows that the inflation cancels the hardware win end-to-end: Qwen3-4B completes BBH in 285s at BF16 but 292s at INT4, despite kernels running 1.2 to 1.4× faster.
Tradeoffs
Consistent inflation
We paired every completion by item and repeat index, dropped any pair where either side ran away, and took the median ratio against the creator's endpoint.
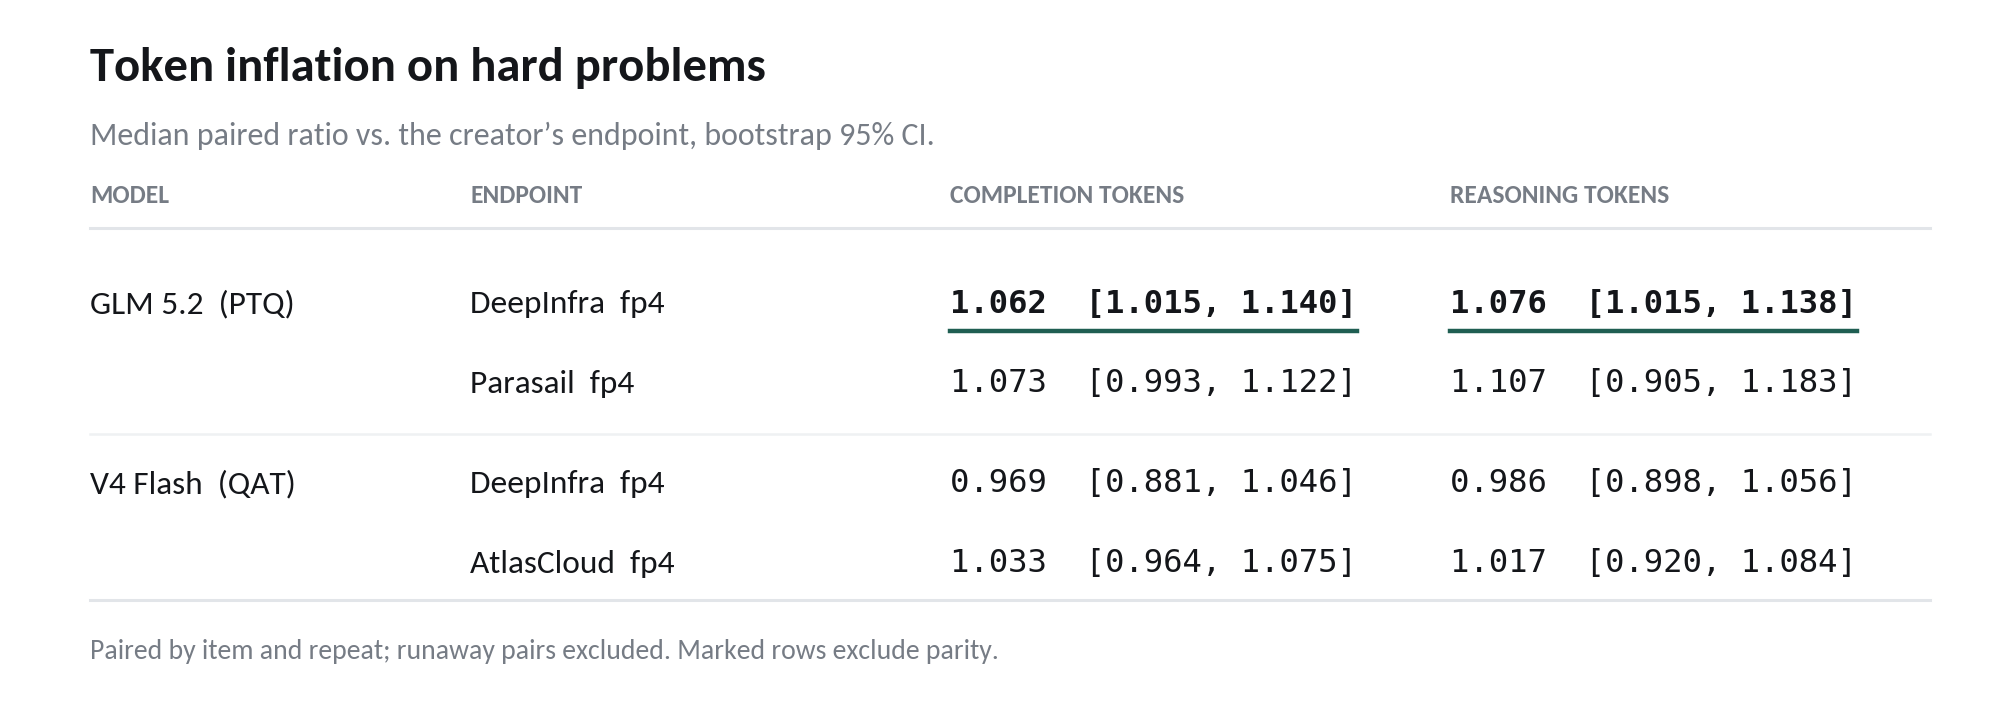
GLM’s DeepInfra endpoint runs about 6% longer on completions and 8% longer on reasoning, with confidence intervals clear of parity. Parasail agrees on both direction and magnitude, at about 7%, though its interval touches 1.0.
The QAT model doesn’t show this. Both V4 Flash endpoints sit inside ±3.5% with intervals straddling parity.
As previously mentioned, this also seems to only appears when the tasks are difficult. Our earlier pilot on easy problems found these same endpoints at median parity. The inflation arrives once the model has to reason at length, which is exactly the workload reasoning models are sold for, and exactly where a buyer comparing per-token rates has the least visibility. Including the runaway pairs barely moves the medians (1.069 and 1.076 on GLM).
Long-tail runaways
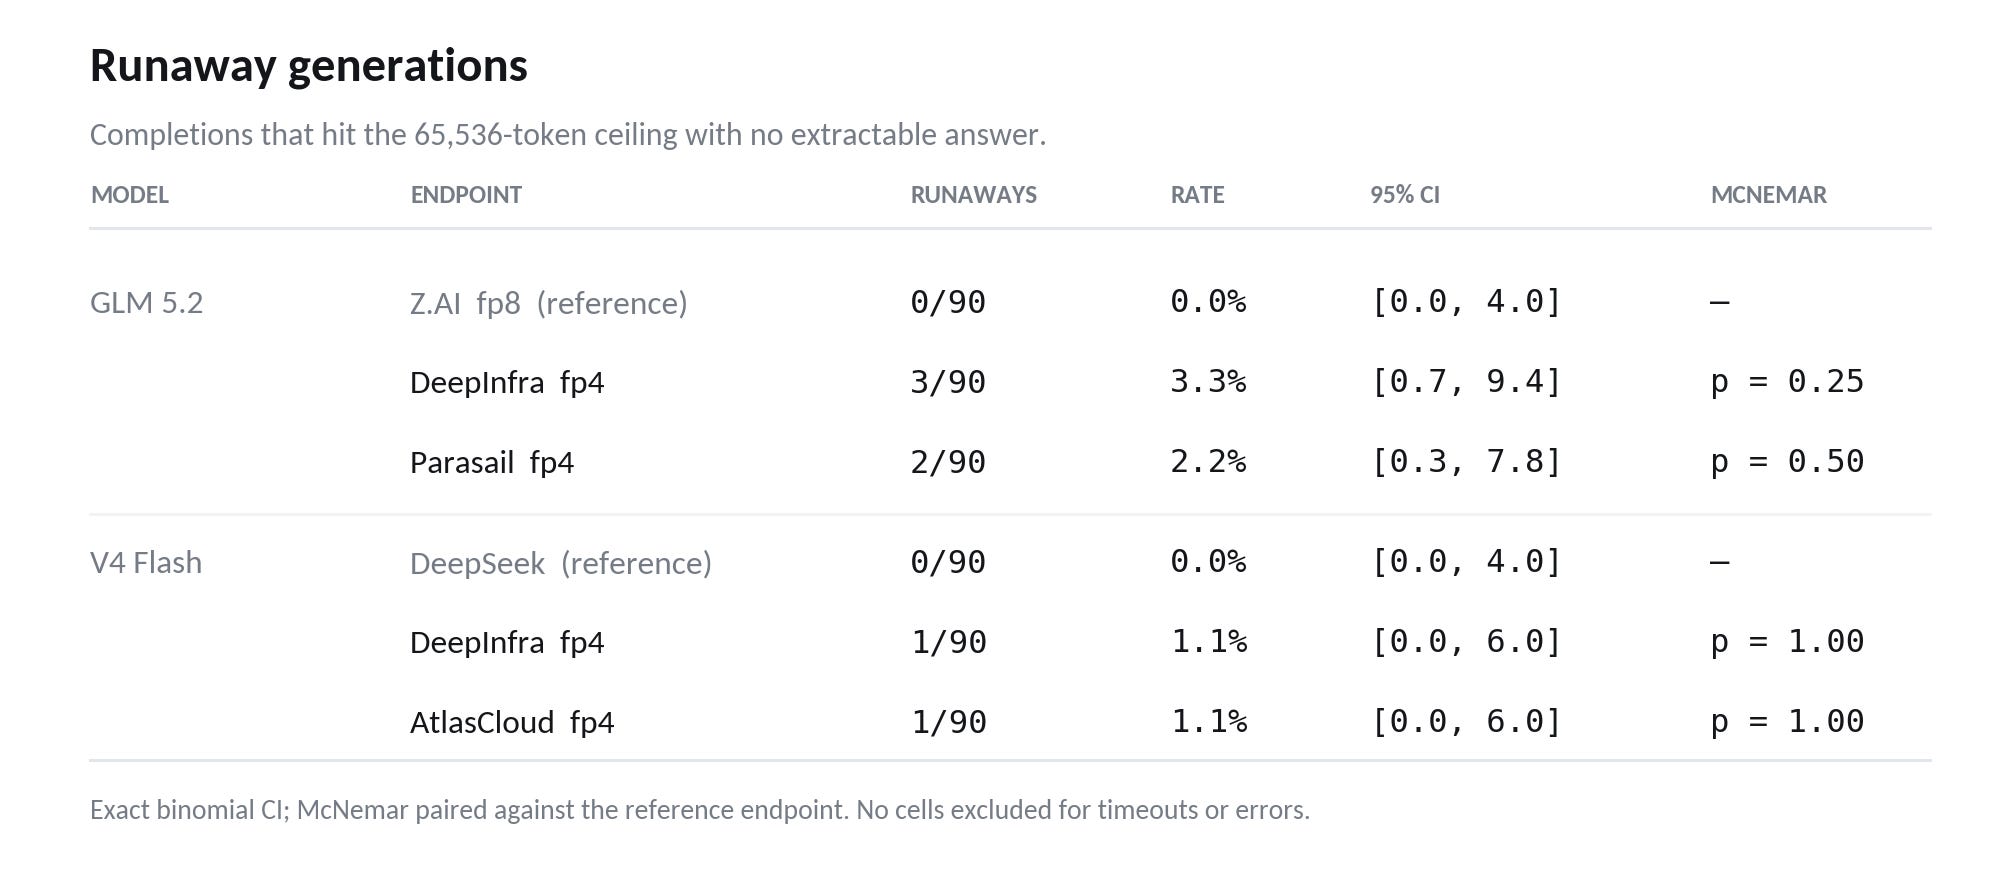
Every runaway we observed on GLM 5.2 happened on an FP4 endpoint.
Unfortunately, the runaway results are also not statistically significant. Paired McNemar tests give p = 0.25 and p = 0.50; at 90 cells per arm we simply cannot distinguish a 3% rate from a 0% rate. This was our pre-registered primary outcome and it came out directional rather than confirmed: we can claim that every runaway occurred under FP4, and that runaways are expensive, but not that FP4 raises the runaway rate.
Interestingly, the traces do show more significant findings. The published account of quantized reasoning failure is overthinking: the model second-guesses itself into an endless deliberation loop, and the proposed fix is a decoding penalty on markers like "wait," "but," and "alternatively," which cuts chain-of-thought length by 12 to 23% and overthinking errors by up to 58%. Our runaways show the opposite behavior. They are marker-poor: 1.09 markers per thousand tokens versus 1.45 in normal completions on DeepInfra, 0.40 versus 1.24 on Parasail, with the same pattern on V4 Flash. So instead of agonizing over a problem, the quantized model falls into a failing grove and fills tokens with it. If that is right, the standard mitigation would not help, because there is no overthinking to penalize.
Also worth noting that an operator reached a similar conclusion independently. Umans trialed NVFP4 GLM-5.2 for four days at the end of June, hit 200+ tokens per second at roughly 420GB per copy against 744GB at FP8, and pulled it from customers shortly after. Users reporting chains of thought collapsing before deep context. Their resulting policy is to serve models only at the precision they were post-trained for.
Distributional equality
These results left us wondering whether the providers were even serving the same output distribution.
We used the Model Equality Testing framework of Gao, Liang and Guestrin (ICLR 2025), which formalizes this as a two-sample test between an endpoint's completions and a reference distribution, using a maximum mean discrepancy statistic under a Hamming string kernel with permutation p-values. What does this mean, you ask?Roughly: it measures how far apart two endpoints' output distributions are, then checks whether that distance is bigger than you'd get by chance.
Applied to 31 commercial endpoints in 2024, their test flagged 11 as serving distributions that differed from Meta's released weights. We ran it with their package on 140 shared samples over 80 prompts per pair, completions truncated to 512 tokens, 500 permutations.
Both GLM 5.2 FP4 endpoints reject distributional equality with the reference but the V4 Flash endpoints don’t.
The FP4-versus-FP4 comparisons were included as a same-distribution sanity check. Neither rejects at α = 0.05, but GLM's is closer to rejection (p = 0.060) than V4 Flash's (p = 0.086), so the two PTQ stacks are not identical to each other either. Effect sizes order as GLM FP4-vs-reference (0.065, 0.051) > GLM FP4-vs-FP4 (0.031) > all V4 Flash comparisons (≤ 0.025).
Token accounting
Each request was counted three ways: the provider’s usage field, OpenRouter’s generation endpoint, and local retokenization of the returned text with the model’s own tokenizer.
Reasoning-token counts from third-party endpoints under-report the reasoning text they returned: 0.581 (DeepInfra, GLM 5.2), 0.570 (Parasail, GLM 5.2), 0.683 (DeepInfra, V4 Flash). Both creators’ endpoints report 1.000. OpenRouter’s native_tokens_reasoning carries the same discrepancy (0.589, 0.638), consistent with pass-through rather than independent measurement.
Completion-token counts, which determine billing, matched local retokenization at 1.001 on every endpoint.
Separately, tokens_completion from OpenRouter’s generation endpoint runs 1.58 to 1.81× below the provider’s completion_tokens on all six arms including both references, consistent with reasoning tokens being excluded from that field. Spend estimates built on it will understate cost. We used OpenRouter’s total_cost as ground truth throughout.
Both findings replicate our pilot on both models. The practical consequence is that the usage field a buyer would use to detect token inflation under-reports by roughly 40% on the endpoints where inflation occurs, while the field that determines the invoice is accurate everywhere.
Perhaps we are missing something here, but it does seem to be a bug.
Limitations
Our pre-registered primary outcome, elevated runaway rates on FP4, was directional and not significant. Five runaways against zero at 90 requests per endpoint does not establish a rate difference; a larger run would be required.
Additionally, not all quantization algorithms are alike. OpenRouter labels the endpoint FP4 and that is all a buyer gets. Published PTQ inflation runs from about 4% to over 40% depending on the algorithm, so a provider with a cruder recipe would look worse than what we measured, further obscuring effective pricing.
Finally, our screening filtered out items the creator’s endpoint failed to solve. That measures the extra failure FP4 introduces on problems the reference handles, which is the comparison we wanted, but its not the failure rate for average use. For what it is worth, the FP8 reference ran away on 4 of the 45 candidates during screening. Runaways are not FP4-only; they are just relatively more expensive when the endpoint that produces them is less expensive.
What this means if you are buying tokens
Price per token is not the listed price. On these endpoints the listed rate and the rate actually paid disagreed by enough to flip the sign of a 32% discount. If you are choosing a provider, measure cost per completed task on your own workload. It is a couple of hours of work and it might surprise you.
Treat max_tokens as a deductible rather than a safety limit. A runaway costs exactly max_tokens times the output price and returns nothing you can use.
Prefer models trained for low precision (QAT) when someone else is doing the quantizing. This is the cleanest result we have, and it is not only ours: the research literature finds quantization-aware training to be the most reliable mitigation, and at least one provider has independently concluded that serving a model below the precision it was post-trained for is not worth the throughput.
Do not trust reasoning-token counts from anyone but the model’s creator. Count the tokens yourself, or use the billed figure.
Lastly, because benchmarking these models is inherit friction on the buyers, providers could be selling “lemons”, whether they know it or not. The industry needs rolling benchmarks to keep providers in-check and inform buyers.
 | A guest post by
|